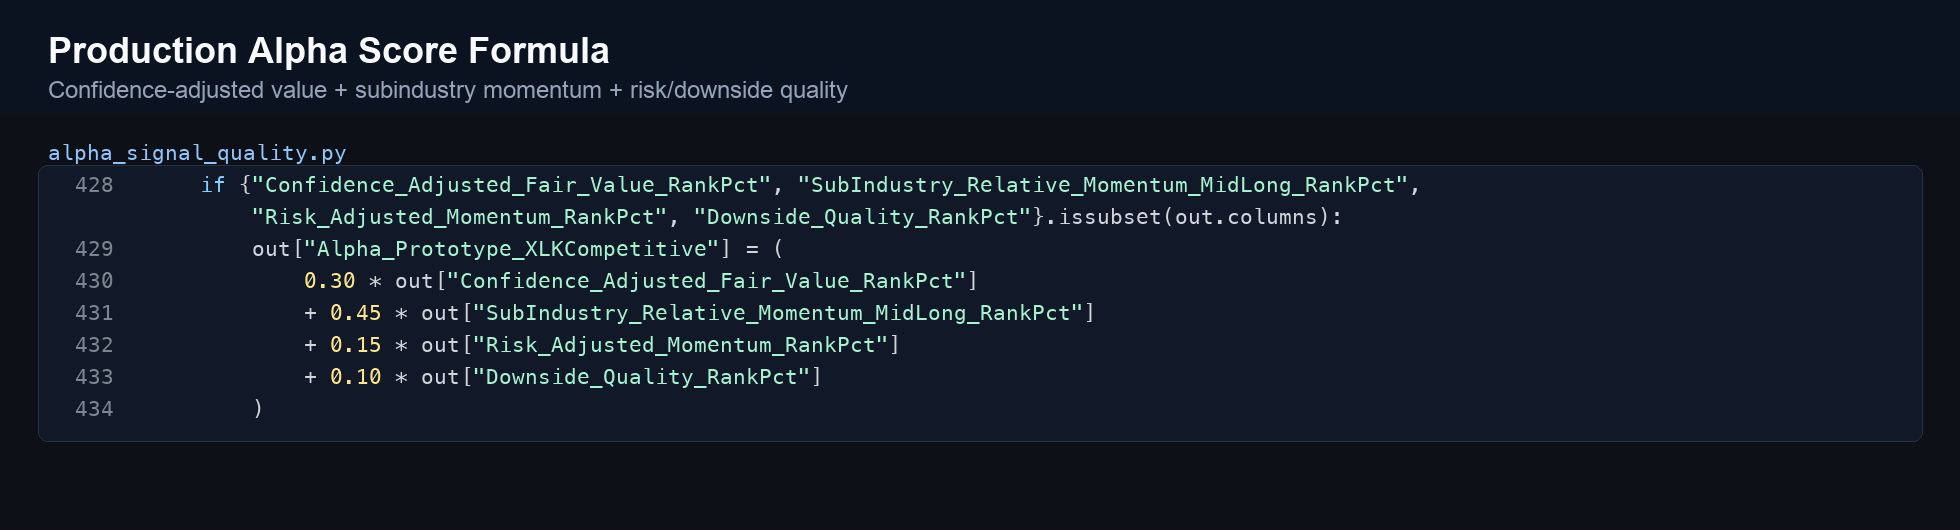
The feature pipeline supports both model generations. Regime-dependent weighting belongs to the original model; the current ranking uses the fixed alpha blend below.
Data preparation
The model starts by building a technology-stock universe, removing stale symbols, and keeping a historical membership record so old tests do not simply assume today’s universe always existed. It then aligns daily price history with point-in-time financial statement data, using filing-date cutoffs so historical scoring only uses information that would have been available at the anchor date.
The pipeline keeps source and confidence fields beside the scores. That matters because a missing share count, missing filing, or too-small peer group can make a fair-value score unavailable or less reliable. The workbook now reports those reasons instead of silently returning misleading numbers.
Universe and dates
Filter to the technology universe, preserve historical membership windows, and choose scoring anchor dates.
Market data
Load adjusted prices, volume, liquidity, moving-average context, returns, and benchmark price history.
Fundamentals
Use financial statement values available by filing date, then calculate market cap, enterprise value, cash-flow, growth, and profitability metrics.
Diagnostics
Track missing values, peer-count problems, valuation source, share-count source, and fair-value coverage before ranking.
Peer grouping
The core comparison happens inside subindustries, then fair-value scoring narrows that group again by size bucket. In practice, a stock first competes with companies that share a similar business model, then its valuation metrics are benchmarked against the Small, Mid, or Large bucket assigned inside that subindustry. That avoids comparing a mega-cap platform company directly against a much smaller niche software or hardware company.
If a subindustry is too small for a stable benchmark, or if a ticker is not assigned to a benchmark bucket, the row is flagged rather than forced into a fake fair-value score. The output also keeps industry-level and subindustry-level trend context so the stock’s movement can be read against both its close peers and the broader technology group.
Trend calculations
The price-trend score looks at short and medium-term price behavior instead of a single return. Features include 20- and 50-day distance-to-high behavior, moving-average stack, hold-above-50-day behavior, new-low penalties, 50-day return, distance from the 20- and 50-day moving averages, and higher-high checks. The model calculates this at the stock level and also summarizes trend strength at the subindustry and industry level.
Valuation metrics
The fair-value layer converts financial statements into comparable metrics, then ranks each stock relative to its subindustry-and-size benchmark bucket. Inputs include revenue, net income, operating income, gross profit, operating cash flow, free cash flow, market cap, enterprise value, EBITDA, EPS, share count, and net debt. Derived metrics include EV/EBITDA, EV/forward FCF, gross profit to enterprise value, price to sales, PEG, free-cash-flow margin, revenue growth, EPS growth, and ROIC-style measures.
| Feature family | What it answers | Example fields |
|---|---|---|
| Trend | Is the stock gaining or losing momentum compared with its own recent history and peer group? | 50-day return, moving-average stack, new-low penalty, higher highs |
| Fair value | Does the company look expensive or cheap relative to similar technology businesses? | EV/EBITDA, EV/FCF, price/sales, PEG, ROIC, FCF margin |
| Regime | Should the model trust trend more, or lean harder on valuation and risk? | Industry regime, subindustry regime, stock-flow regime, structural regime |
| Confidence and risk | How much should a strong score be trusted after data coverage, volatility, and downside behavior? | Fair-value coverage, share-count source, risk-adjusted momentum, downside quality |