← All projects

Technology stock ranking

Original model

The original peer-relative approach: combine price trends and fair value, then adjust their weights using market regimes.

Original model approach

This flow explains the original trend/value design and its transition to the current ranking output. The fixed alpha formula is documented on the Current Model page →

Core idea

Rank each stock by asking two questions: does the company look financially attractive versus its closest peers, and is its price action being confirmed by the stock, subindustry, and broader industry trend? For fair-value benchmarking, “closest peers” means the same technology subindustry plus a size bucket such as Small, Mid, or Large. Regime logic then decides how much the original model should trust trend versus fair value.

How one stock is judged

  1. Peer setPlace the company inside its subindustry, then use its Small/Mid/Large benchmark bucket for fair-value peer comparisons.
  2. Fair Value ScoreScore the company’s valuation, growth, cash-flow, profitability, and coverage quality relative to that peer group.
  3. Price Trend ScoreMeasure whether the stock is participating in a healthy trend using moving averages, returns, new-low penalties, and peer momentum.
  4. Regime weightsClassify the market, industry, and subindustry backdrop so the original combined score can lean more toward trend in stronger regimes and more toward valuation/risk in weaker ones.
  5. Ranking outputExport the original combined score for transparency, then use the current alpha score for the website demo ranking and simulated portfolio tests.
Original score construction

Original combined score

Trend Weight × Price Trend Score + Benchmark Weight × Fair Value Score

The original score is the workbook-facing score shown in the Excel preview. It blends price trend and fair value, and its weights change with regime. In stronger regimes, the model gives more weight to price behavior. In weaker or less clear regimes, the model gives more weight to fair value and benchmarking.

Regime classification

The regime layer exists because the same valuation signal can behave differently in different markets. The model labels the industry and subindustries using trend participation and stock-flow behavior. In the latest saved workbook, the technology industry was classified as Bull, with many subindustries classified as EarlyBull and some as Neutral. The structural-only label remained conservative, so the page treats it as context rather than proof that every part of the market is bullish.

For the original combined score, those regimes decide the trend/value blend. For the current alpha score, regime information remains part of the broader feature history, while the displayed ranking is driven by a fixed alpha-family score chosen for the website demo.

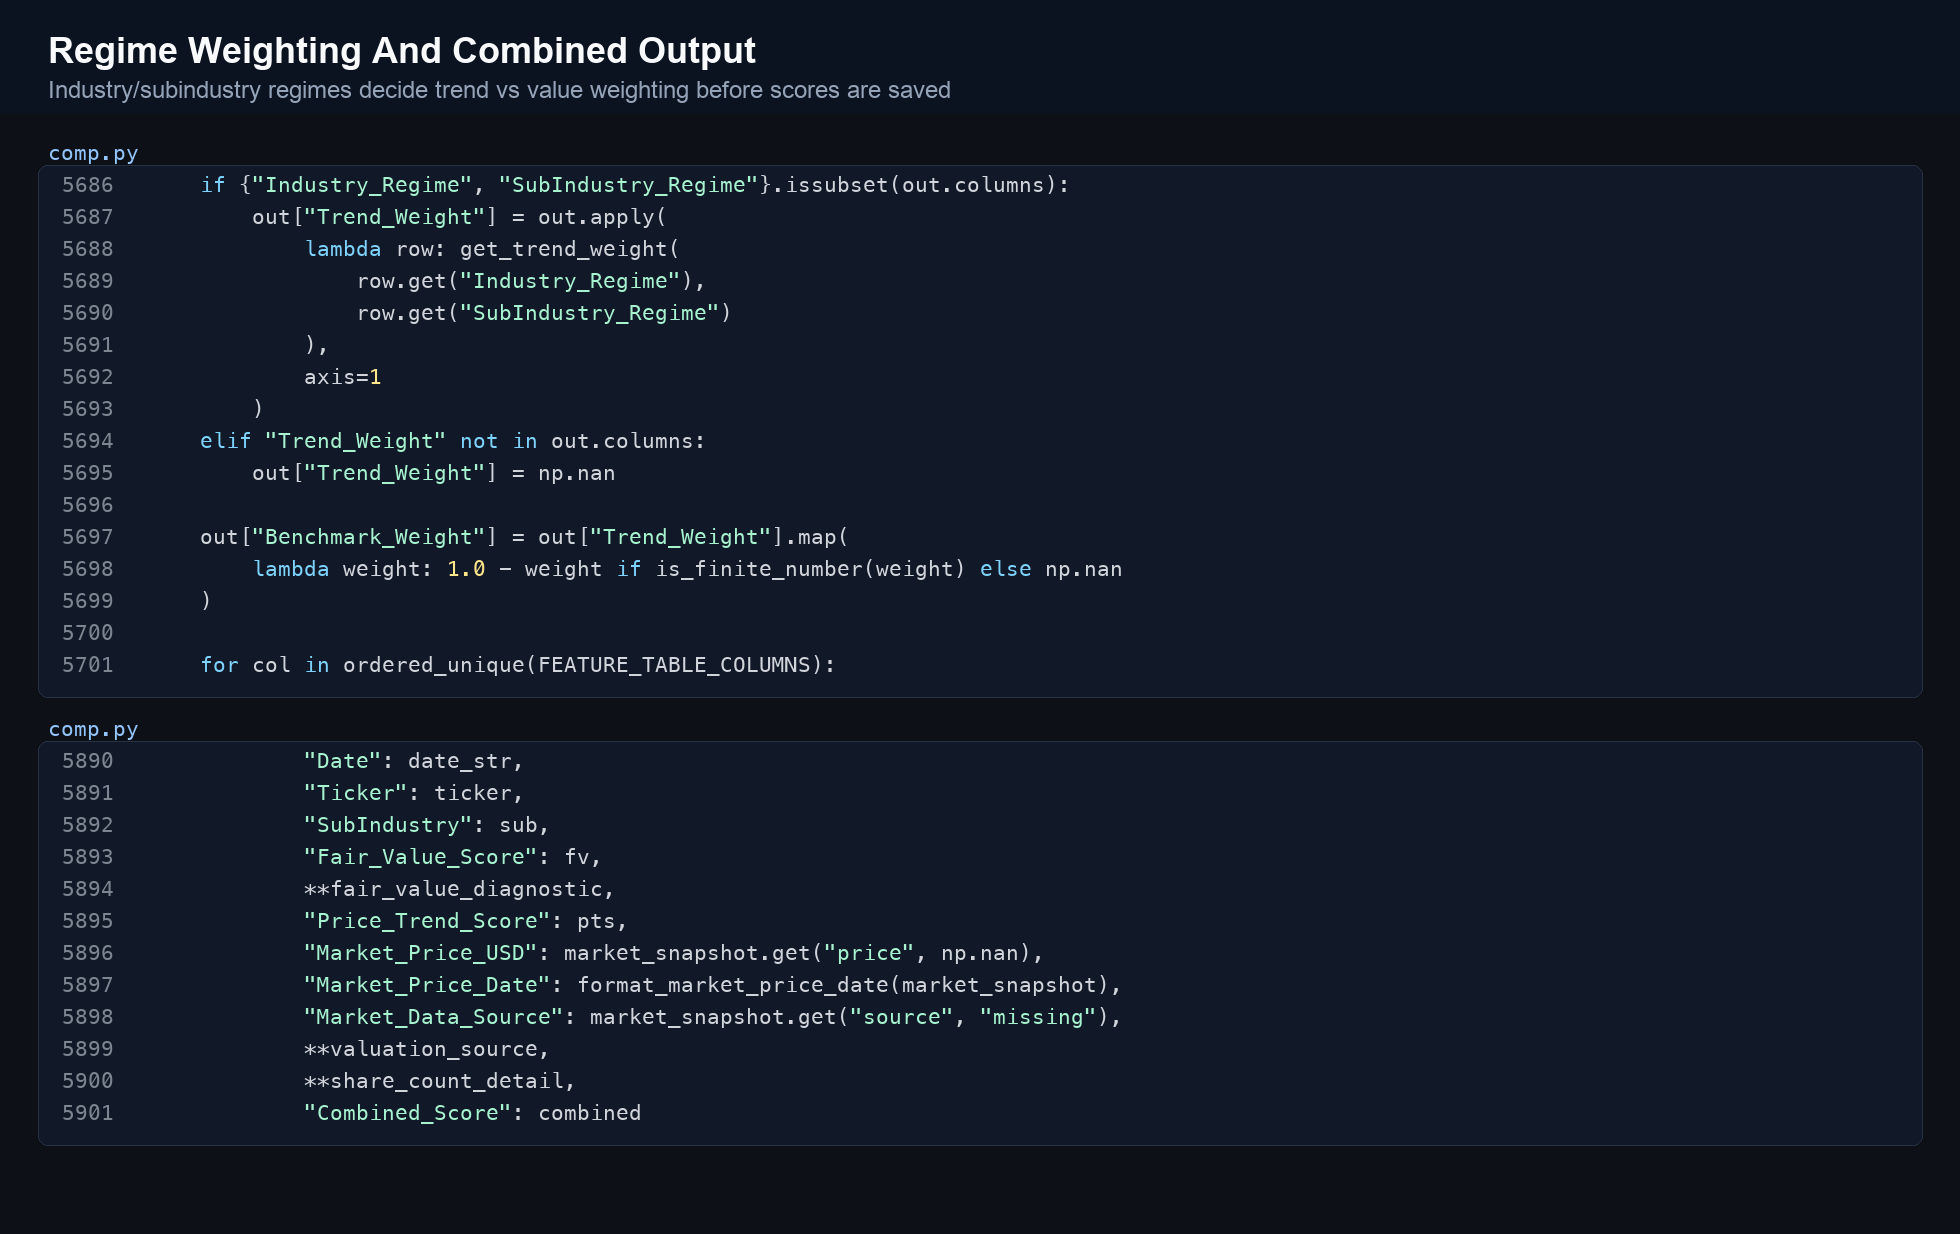
Original scoring code excerpt
Python excerpt deriving trend and benchmark weights from industry and subindustry regimes and exporting combined-score fields
The original regime-weighted scoring layer and feature output. This explains the workbook combined score, not the fixed alpha score. View full size ↗

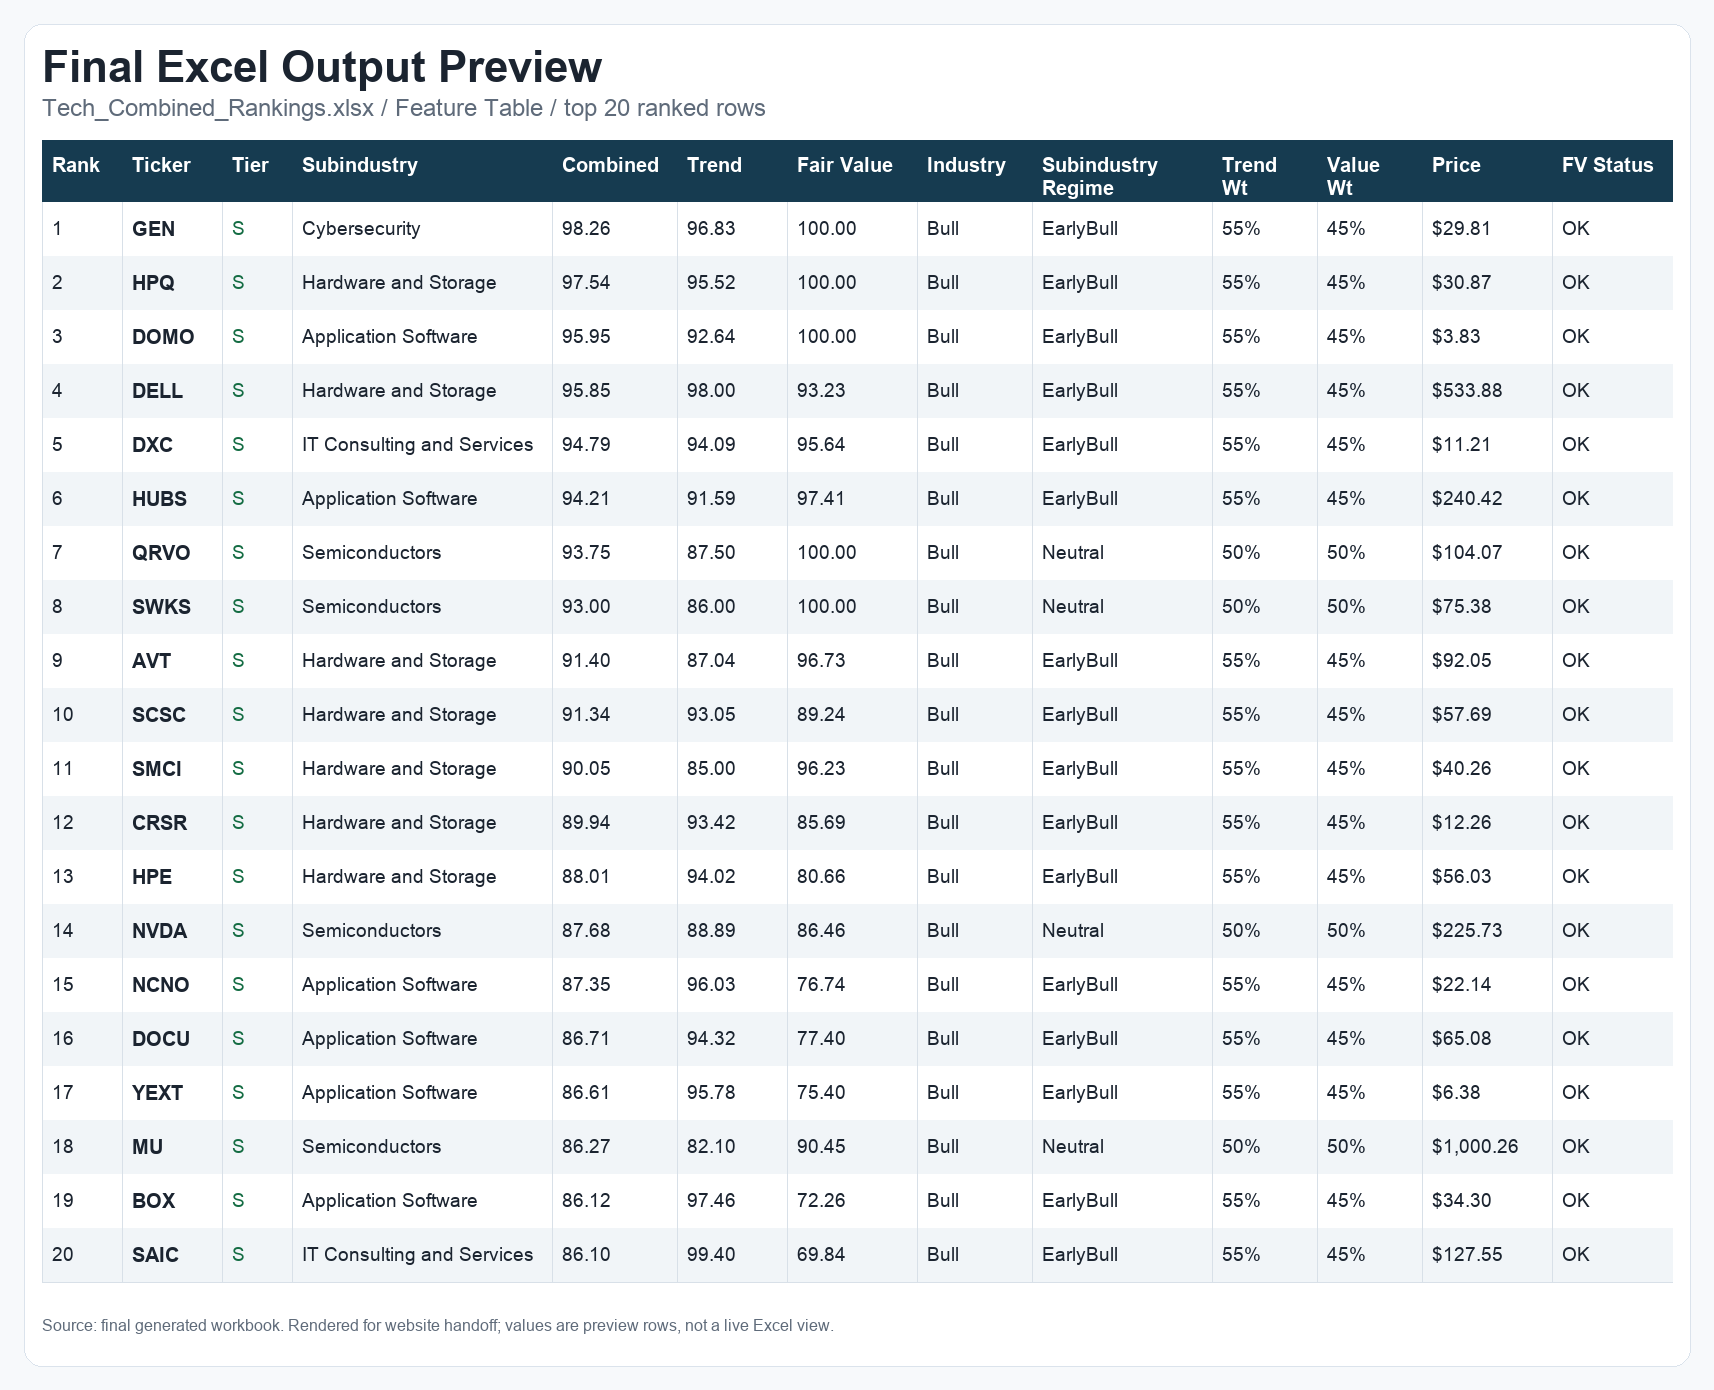
Original Excel output

Top 20 rows of the generated Excel feature table, with subindustries, trend and fair-value scores, regime weights, and data status
Generated Excel output: the original combined-score workbook and its underlying features. This preview is separate from the alpha ranking used by the website demo. View full size ↗